Digital Product Leaders
We specialize in design for data products
Our clients participate directly with us to design, prototype, and test epic digital data products. Here’s how to partner with us, get started
We offer autonomous teams or team augmentation
With expertise ranging from the strategic to the technical, our teams can strategize, design, implement, install, or otherwise bring your ideas to life as successful digital products. We are technology agnostic and routinely assist our clients in architecting strong data strategies.
Boost Labs helps our clients define digital strategies, and bring those strategies to market through Agile and Design Thinking methodologies. Investing in up-front product strategy avoids costly mistakes and inefficiencies of time and resources.
Nobody wants to struggle to analyze a series of Excel charts in a PowerPoint presentation. The most valuable part of your organization is in the underlying data, so make good use of it.
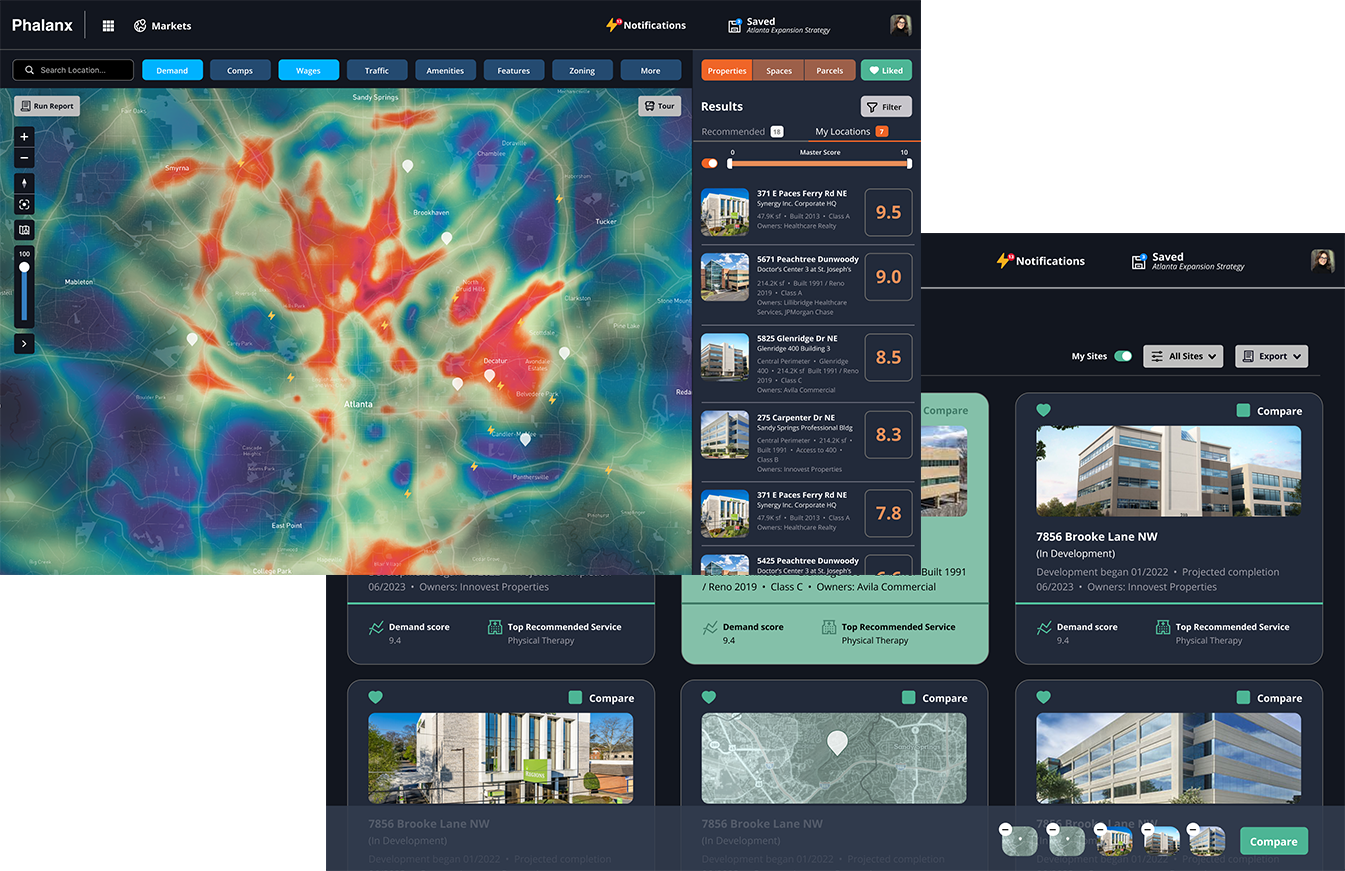
If you want innovative user interface solutions that set you apart from competitors, look no further. We solve application interaction challenges with a best-in-class design process which improves usability, engagement, adoption, satisfaction, and retention.
Transform your vision into an innovative digital product. We help clients formulate baseline technology requirements through dialogue, validating your organization’s existing tech stack. We code, test, and launch new data products into production.
- Data architecture
- DevOps architecture
- Full stack development
- API & geospatial development
- AI & machine learning
- BI platforms
- CMS platforms
- 3D & augmented reality
- Quality assurance methods
- Performance metrics
Industries
Automotive
BMW Car Club of America
Daimler
Top Gear
TrueCarVolvo
Healthcare
Adaptive Phage Therapeutics
Athena Health
GHX
John’s Hopkins University
Startups
Care Partners
Castler
Jet Juice
Sovereign Intelligence
The Mix
Energy
Baker Hughes
Manufacturing
Hill Group
Non-Profits
1882 Foundation
Antiquities Coalition
DeVos Foundation
EDNET
Freedom House
Truth Initiative
World Justice Project
Travel
Advito
BCD Travel
Celebrity Cruises
Royal Caribbean
Finance
BNY Mellon
FMS Solutions
HG Capital
The RMR Group
Travelers
Vanguard
NGOs
Abt Associates
ACEEE
BLJ Worldwide
Kimetrica
NBR
RIVA Consulting
Westat
Technology
1901 Group
Broadsoft
Buchanan & Edwards
Cisco
Disys
GURU
Latitude
Prologis
Resonate
Vertical Scope
Government
Census Bureau
Dept of Transportation
Dept of Education
Dept of State
HUD
SBA
USAID
US ARMY
White House Initiative on AAPI
White House Initiative on HBCUs
Real Estate
Avison Young
JBG Smith
Link Logistics
Radian
ROSSI CRE