By now, you probably know that data needs structure and context to uncover actionable insights, which is why data visualization is such a powerful tool. However, analysis isn’t a one step process that presents all possible insights at once. There are instances when you need further analytics to expound key insights, mainly when things aren’t right. Projects can fail, people lie, resources can dwindle, and basically anything else that creates complications. So how do you even begin to dive deeper into data that isn’t explicitly connected to your data? By using data visualization as a first step, you can begin explore new correlations.
Tracking damages
Oftentimes, looking for insights means looking for the root of the problem. When looking for patterns, visualizations are a great way to represent important data points because they build connections.
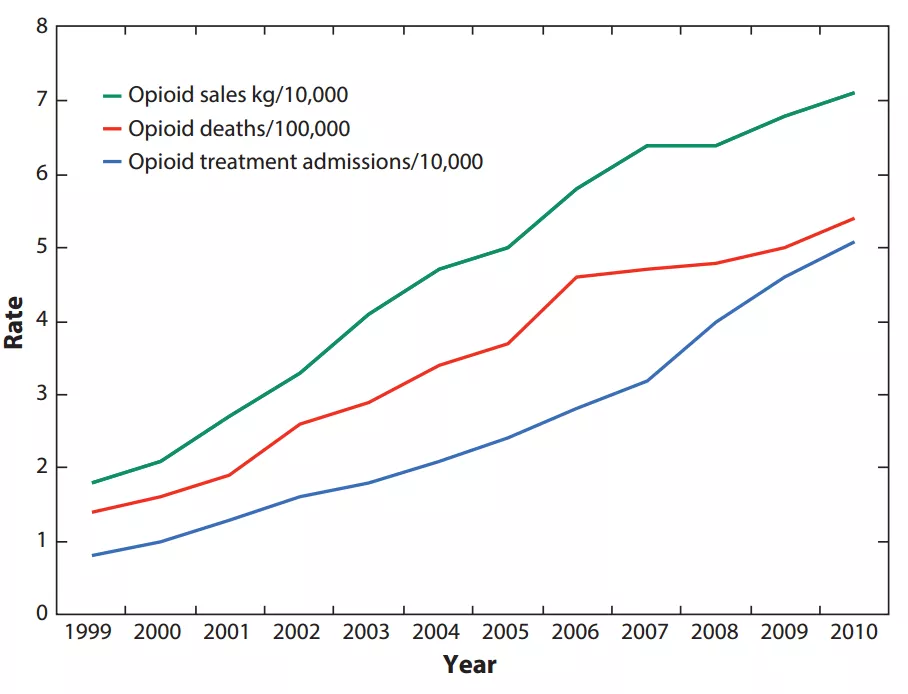
A graph as simple as this line chart shows the correlation between opioid sales and opioid related deaths. This correlation is a key point in the fight against the biggest opioid drugmaker and their responsibility of causing an addiction crisis in America. Ending the crisis requires solid and accurate data insight so perpetrators can be brought to justice.
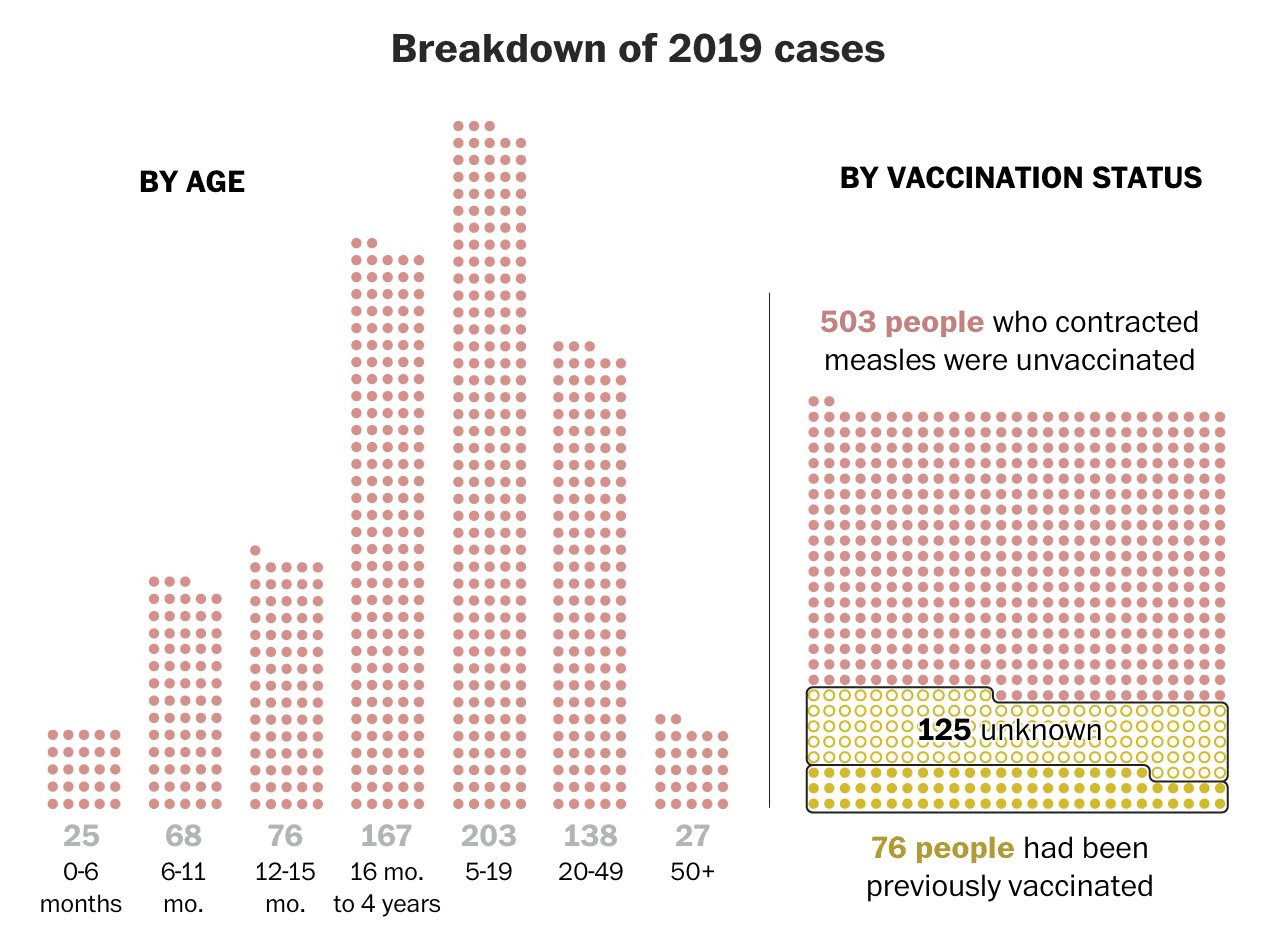
The current resurgence of measles can be linked to the rise of anti-vaccination sentiment in communities. A visual can show us that most current cases of measles occur in unvaccinated children under 18 years. Again, this is only a stepping stone to connect audiences to more complex analytics that influence the public sentiment and increase vaccinations.
With insights like these, organizations and groups can execute more efficient and effective operations.
Business performance
Business performance is usually measured using KPI’s that indicate items like revenue and sales. But we all know that there are always external factors that affect business and finding those connections aren’t the easiest thing to do. Consider social media, a veritable hub of constant activity. Today, you can even shop through Instagram. So now there are new KPI’s and metrics to consider as well as new correlations. The social media counterfeit market makes about $1.2 trillion in a year. Common payment apps include WeChat Payment and PayPal. It’s in the best interest of the real brands and businesses to investigate counterfeiting because it affects brand image. No matter how much you think you know, you never have the full picture. When more people buy cheap knock-offs, it’ll change sales and public image. How does it change? Use deeper analytics to find the connection.