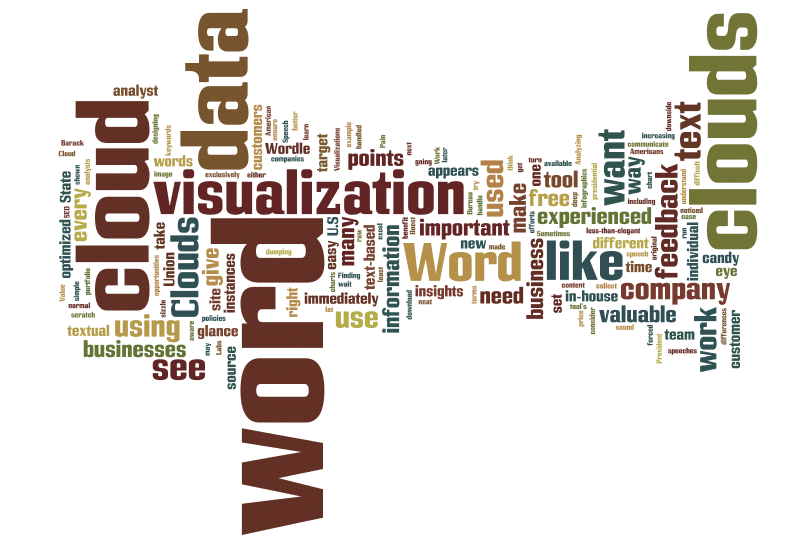
Data visualizations (like charts, graphs, infographics, and more) give businesses a valuable way to communicate important information at a glance, but what if your raw data is text-based? If you want a stunning visualization format to highlight important textual data points, using a word cloud can make dull data sizzle and immediately convey crucial information.
When you’re looking at an in-depth data analysis, do you find it difficult to discern which points are the most important?
Anyone who’s ever stared blankly at a lengthy database or long pages of text can relate. With so many insights to comprehend, how do you know where to begin?
Word cloud generators can help simplify this process.
If you’ve ever looked at a jumble of disparate words that seem to have no correlation until you investigate further, you’ve seen a word cloud. These are powerful tools across myriad industries, from art to science.
Today, we’re exploring their use in the field of data visualization. Along the way, we’ll share how your organization can use them to help pinpoint important issues and better direct your steps forward.
Ready to learn more? Let’s get started!
What are Word Clouds?
Word clouds (also known as text clouds or tag clouds) work in a simple way: the more a specific word appears in a source of textual data (such as a speech, blog post, or database), the bigger and bolder it appears in the word cloud.
A word cloud is a collection, or cluster, of words depicted in different sizes. The bigger and bolder the word appears, the more often it’s mentioned within a given text and the more important it is.
Also known as tag clouds or text clouds, these are ideal ways to pull out the most pertinent parts of textual data, from blog posts to databases. They can also help business users compare and contrast two different pieces of text to find the wording similarities between the two.
Perhaps you’re already leveraging advanced data visualization techniques to turn your important analytics into charts, graphs, and infographics. This is an excellent first step, as our brains prefer visual information over any other format.
Yet, what do you do if your raw data is text-based in nature?
Much of the research your organization conducts will include at least some form of an open-ended inquiry that prompts respondents to give a textual answer.
For instance, you might ask current customers what they like or don’t like about your new product line. Or, you could ask them to give suggestions on how your organization could improve. They could also have the chance to elaborate on any pain points they’re experiencing.
There are industry tools that allow you to code such open-ended data so users can understand it quantitatively. Yet, these don’t come cheap. Word clouds offer a cost-effective, yet powerful, alternative.
With these, you can still quantify your text-based insights into measurable analytics. The only difference? You won’t create a chart or graph as you would with a set of numbers.
Instead, you’ll create a word cloud generator to transform the most critical information into a word cloud.
Here’s an example from USA Today using U.S. President Barack Obama’s State of the Union Speech 2012:
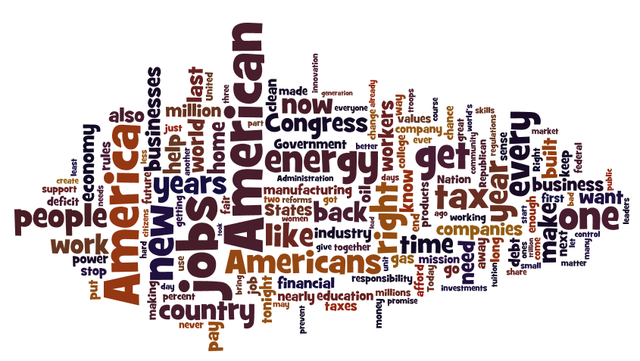
As you can see, words like “American,” “jobs,” “energy” and “every” stand out since they were used more frequently in the original text.
Now, compare that to the 2014 State of the Union address:
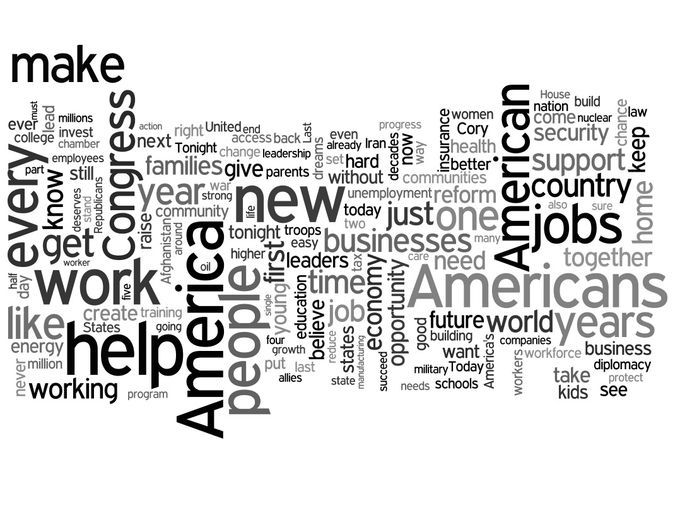
You can easily see the similarities and differences between the two speeches at a glance. “America” and “Americans” are still major words, but “help,” “work,” and “new” are more prominent than in 2012.
Using word clouds isn’t exclusively for creating presidential eye candy. Keep reading to discover how word clouds can benefit your business.
Where Word Clouds Excel for Businesses
In the right setting, word cloud visualizations are a powerful tool. Here are a few instances when word clouds excel:
- Finding customer pain points — and opportunities to connect. Do you collect feedback from your customers? (You should!) Analyzing your customer feedback can allow you to see what your customers like most about your business and what they like least. Pain points (such as “wait time,” “price,” or “convenience”) are very easy to identify with text clouds.
- Understanding how your employees feel about your company. Text cloud visualization can turn employee feedback from a pile of information you’ll read through later to an immediately valuable company feedback that positively drives company culture.
- Identifying new SEO terms to target. In addition to normal keyword research techniques, using a word cloud may make you aware of potential keywords to target that your site content already uses.
When Word Clouds Don’t Work
As mentioned, word clouds aren’t perfect for every situation. You wouldn’t use a pie chart to show company revenue growth over time, and you shouldn’t use word clouds for every application, either. Here’s when you want to avoid using a word cloud.
- When your data isn’t optimized for context. Simply dumping text into a word cloud generator isn’t going to give you the deep insights you want. Instead, an optimized data set (one handled by an experienced data analysis team) will give you accurate insights.
- When another visualization method would work better. It’s easy to think “Word Clouds are neat!” and overuse them — even when a different visualization should be used instead. You need to make sure you understand the right use case for a word cloud visualization.
There are many other instances when a different visualization should be used over word clouds. (Feel free to contact one of our data analysts to learn more.) More complex data sets and projects require a team of developers and designers for a complete transformation. In could an infographic or dashboard, but word cloud applications are limited to, well, words.
What is a Word Cloud Generator?
As its name implies, an online word cloud generator is a tool that scans a body of text, turning it into component words.
From there, it can create a word cloud that highlights the most frequently mentioned words. If you don’t prefer the cluster shape, most tools enable you to format the word cloud in various ways, including:
- Horizontal lines
- Columns
- Formed to fit a certain shape
Most providers will also allow users to choose different layouts, fonts and color schemes depending on their preference. This means you can make one to match the color scheme of your brand, your partners, or your clients.
While the color used on a word cloud holds a primarily aesthetic value, you can contrast the hues to help categorize words or illustrate a separate data variable.
Why Use a Word Cloud Generator?
Think word clouds aren’t relevant to your organization? Think again.
These are an unexpected yet powerful way to display important data visualizations. Let’s take a look at a few of the top ones.
1. Understanding Client Issues
How are you currently analyzing your customer satisfaction levels? From polls and surveys to social media posts and more, your audience is talking about your brand.
As they do so, they’re delivering valuable insights into the psyche of your target customer. What’s making them tick and what to do they love? Are there any issues that seem to pop up time and again?
It can be difficult to find the answers to these questions if you’re simply reading each comment on an individual basis. Yet, when you create a word cloud with this feedback, you can quickly visualize what everyone is talking about.
For instance, you might notice that phrases such as “wait time” or “attitude” appear to dominate the cloud. This can reveal your customers’ pain points.
Or, you might see positive terms such as “affordable” and “customer service” towering over others, revealing what you’re doing right. Either way, you’ll know which topics to focus on at your next meeting, and you’re already one step in the direction of change.
2. Quickening Business Actions
That important marketing research report just came in at 5:00 p.m. The only problem? It’s 50 pages long.
You’d love to read through it line by line, but you don’t have enough hours in the day, and you’re supposed to give a brief on the data the next morning. This is where a word cloud generator can help.
When you copy the text into the generator and let it do its job, you can see in seconds which talking points appear the most frequently. Then, you’ll know where to start your search to hit the most important parts.
3. Analyzing Employee Sentiment
When you ask employees to share their feedback and opinions about the workplace, what do you do with those responses? It can be difficult to turn this kind of unstructured data into meaningful action if you don’t know where to start.
This is where word cloud visualizations can help.
When you’re able to see which points your employees are discussing at the highest rate, you’ll know how to make valuable and meaningful changes that can boost morale, strengthen company culture, and improve performance.
4. Simplifying Technical Data
You could present highly technical researching findings to a non-technical audience, such as your community board of directors. Yet, when you do so, it’s common to look into an audience of blank stares.
When you present a word cloud instead, you’re able to share the same findings in a more accessible and engaging way. This expands your reach and enables you to share important information in a way that doesn’t require advanced technical understanding.
5. Searching for Patterns in Data
With quantitative data, charts, graphs, and other data visualizations can help you identify key patterns. However, pulling these same insights from qualitative data can prove cumbersome at best and impossible at worst.
A word cloud generator makes this process a cinch. Those words you see overpowering the others? Those are your salient points and overlapping themes.
These would be difficult to find in a tabular format, but they pop out in a word cloud.
6. Search Engine Optimization
You have a good basic grasp on the kinds of keywords that your target audience wants to see. In fact, you might even use a keyword generator to find the most popular ones in your industry niche.
However, do you really know how Google sees your website?
The answer to this question can make or break your Search Engine Optimization (SEO) strategy.
You can use a word cloud generator to see how your content appears to Google bots and similar machines. While it won’t reveal the more technical elements of SEO such as headers, backlinks, and alt tags, it does help you see the general message that your page conveys.
This is important because when Google “looks” at your page, it does so by scanning its content and code. You might think you’re getting the right points across, but do they really dominate? Your word cloud can reveal if you’re giving enough attention to the keywords that matter.
How to Make a Word Cloud
As shown by their increasing popularity, making a word cloud for your website or business isn’t difficult, but there are some important considerations that need to be made so your visualization is more than just eye-candy. While word clouds can be incredible tools for data visualization, it’s important to understand how to use them the right way.
Step 1: Optimize Your Data Set
First, you’ll want to get a valuable, text-based data set. Make sure the data set you’re using is both text-based and optimized for context. Copying and pasting just any textual data into a word cloud generator might not give you the exact insights you need.
Not sure where to begin?
Our team of data analysts is skilled in taking unstructured text and turning it into an optimized data set. First, we’ll help you make sure the source data you’re referencing is both usable and actionable. Then, we’ll compile it in a way that draws out the most interesting and relevant content. Having an experienced analyst compile this helps to ensure your source data is actually usable.
Step 2: Use a Word Cloud Generator Tool
Once your data set is in place, your next step is to run it through a word cloud generator tool. Many businesses like and use Wordle, but there are many others you can try, too (such as Tagxedo and WordItOut). The downside to these free tools is many sites, including Wordle, automatically add all text clouds to their portfolio. This means any site visitor can see it, potentially undermining your marketing efforts. (Check your individual tool’s policies to see if your word cloud will be used in this way.)There are many online resources and apps you can use to perform this step, including:
- Wordle
- Tagxedo
- Tag Crowd
- WordItOut
- Word Cloud Generator for Chrome
- Word Cloud Python tools
- Google Word Cloud tools
Step 3: Export the Word Cloud
Once you create your word cloud, you need to move it from the program to your files. Some platforms will enable you to download the image as a PDF, although many won’t make that easy. In some cases, you’ll have to take a screenshot of the image and save it that way.
Before you close out of the program and start reviewing the data, there’s one security precaution to keep in mind.
While most of the programs above are either free or low-priced, keep in mind that there can be some drawbacks to the convenience they offer. For instance, any time you create a word cloud in Wordle, it saves it to its virtual portfolio.
This might not be a deal-breaker if the data you’re compiling and analyzing isn’t confidential or highly sensitive. Yet, if you work in an industry (such as healthcare or banking) that emphasizes confidentiality and customer data protection, this can render the service unusable.
It’s also a drawback if you’re using a word cloud for marketing purposes. If anyone can search Wordle’s portfolio, there’s nothing stopping them from tapping into your most compelling data.
An easier, safer and all-around better route to take? Create your word cloud from scratch rather than relying on an online program to do the work for you.
Exporting your word cloud from a free tool might take some work. Sometimes, if download as an image or PDF isn’t available, you’ll be forced to take a screenshot – a less-than-elegant solution.
Here’s what to do if you really want your word cloud to be noticed: consider designing your word cloud from scratch!
Does this sound like a lot for you to handle in-house? Not all companies have (or need) an in-house data analyst. Our experienced team at Boost Labs has experience working with enterprise clients such as the U.S. Census Bureau, small businesses like individual websites, and everything in-between.
Creating Your Own Word Cloud
Sure, it’s simple to plug your text into a virtual generator and receive your custom word cloud in seconds. Yet, as we’ve discussed, this can put your most critical data sets in a vulnerable position.
Instead, why not let our team take the reins and create a one-of-a-kind word cloud that’s all yours? This eliminates the risk of your information falling into the wrong hands.
A data visualization expert can also help you pinpoint the most cloud-worthy parts of your unstructured data set so you’re not sifting through tomes of irrelevant data, attempting to make disjointed parts connect.
We’ll work with the most insight-rich parts and deliver a personalized graphic that you can use in your short-term and long-term department planning efforts.
The Best Word Cloud Generators Are Custom
Around the world, we’re creating and sharing more data than ever before and the trend shows no sign of stopping down.
From sales numbers to online traffic rates, you’ve likely got plenty of quantitative data to analyze and discuss. Yet, are you making as much use out of your qualitative inputs?
These are often some of the most insightful data points your organization can leverage. They’re full of opinion, long-form feedback, and personal reflection. Word cloud generators can help make the most of this content, one visual at a time.
Are you ready to discover the power of word clouds for yourself? We’d love to help.
We’re data visualization experts, dedicated to helping companies turn mind-numbing data into interactive and informative graphics, charts, tables and more. Contact us today and let’s discover something new together.